Register now and start:
- Accessing PAR Training
- Shopping PAR products & tools
- Using online assessments with PARiConnect
PARiConnect saves time, offers insightful reports, & exceptional reliability!

Emotional disturbance (ED) is a term rooted in the research of psychologist Eli Bower in the late 1950s and early 1960s. Bower’s work led to the identification of five principal characteristics that define ED, which were later incorporated into federal law.
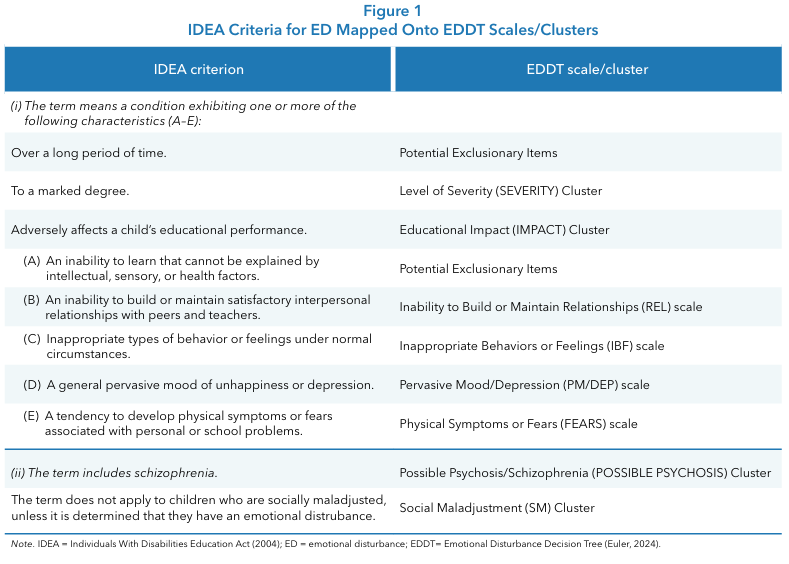
The Individuals with Disabilities Education Act (IDEA; 2004) defines ED as a condition exhibiting one or more of the following characteristics over a long period and to a marked degree, adversely affecting educational performance:
Additionally, ED includes schizophrenia but excludes children who are socially maladjusted unless they also have an emotional disturbance.
Since 1975, there have only been a few minor modifications made to the ED criteria. Students with autism were removed in the early 1980s as autism became its own new eligibility. In 1997, the word “seriously” was removed from the ED title and resulted in “emotionally disturbed,” the category we are familiar with today. Other than these changes, the ED criteria have remained unchanged since its inception.
The importance of identifying and supporting students with ED cannot be overstated. These students often experience significant academic, behavioral, and social challenges, and early identification is critical for effective intervention (Clarizio, 1992; Costenbader & Buntaine, 1999). In each year from 20112012 through 2020–2021, a larger percentage of the students reported under the category of ED exited special education and school by dropping out than for any other disability category (Office of Special Education and Rehabilitative Services [OSERS], 2024).
In the early 2000s, ED was among the more prevalent disability categories in special education. During the 2000–2001 school year, ED represented approximately 7.6% of all students receiving special education services, with about 480,000 students classified under this category (OSERS, 2024). By 2002, the number of students identified with ED had reached approximately 473,663, reflecting an 18.4% increase over the previous decade. This growth, however, did not persist. By the 2011–2012 school year, ED identification had declined to approximately 373,000 students, marking the beginning of a sustained contraction in ED prevalence (OSERS, 2024).
Contemporary data indicate that ED now represents a substantially smaller proportion of the IDEA population. Currently, approximately 1% of the total school-age population is classified with ED, corresponding to roughly 4%–5% of all students receiving special education services (Annual Disability Statistics Compendium, 2024; National Center for Education Statistics [NCES], 2024; OSERS, 2024). In the 2022–2023 school year, ED accounted for approximately 4%–6% of students ages 3–21 served under IDEA, placing it well below the largest eligibility categories such as specific learning disabilities and other health impairment (NCES, 2024). National child count data further indicate that approximately 327,000 students were identified with ED in recent years, even as overall special education enrollment continued to increase (Annual Disability Statistics Compendium, 2024; NCES, 2024).
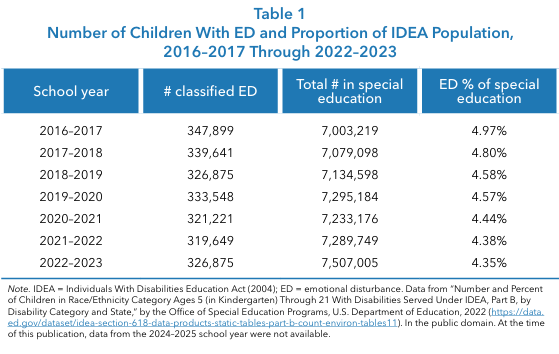
Longitudinal IDEA data confirm that ED identification has declined steadily in both absolute numbers and proportional representation over the past decade. Between the 2014–2015 and 2022–2023 school years, the ED child count decreased from approximately 365,000 to 326,875, while ED’s share of the IDEA population fell from 5.3% to 4.35% (NCES, 2024; see Table 1). Over the same period, total IDEA enrollment increased to approximately 7.5 million students, representing nearly 15% of public school enrollment. These patterns, summarized in Table 1 for the 2016–2017 through 2022–2023 period, demonstrate that ED is not a growth category within special education and that its prevalence continues to decline relative to the expanding overall IDEA population.
ED classification also exhibits marked demographic differences. Males remain significantly more likely than females to be identified with ED, with reported ratios ranging from 4:1 to 5:1 (OSERS, 2024). Collectively, these findings indicate that ED has transitioned from one of the more prominent special education categories in the early 2000s to one of the smallest and most selectively applied classifications in contemporary practice.
Multiple, interacting factors contribute to contemporary trends in the identification of ED in U.S. public schools. Importantly, the observed decline in ED eligibility should not be interpreted as evidence of reduced emotional or behavioral need among students. National mental health surveillance data indicate that student need has moved in the opposite direction, particularly with respect to internalizing symptoms.
The 2023 Youth Risk Behavior Survey (YRBS) found that approximately 40% of high school students experienced persistent feelings of sadness or hopelessness, nearly 20% seriously considered suicide, and about 9% reported a suicide attempt (Centers for Disease Control and Prevention [CDC], 2023). Although some indicators showed modest improvement from 2021 to 2023, emotional distress remains historically high and is accompanied by worsening concerns related to school safety, bullying, and absenteeism.
Broader population data further document increases in anxiety and depressive disorders among children and adolescents between 2016 and 2021 (CDC, 2022). Together, these findings highlight a persistent mismatch between rising student mental health needs and the absence of a corresponding increase in ED eligibility.
This mismatch appears to be driven, in part, by diagnostic substitution and evolving service delivery practices. Longitudinal IDEA data demonstrate substantial growth in eligibility categories that frequently absorb students with emotional and behavioral impairments, particularly other health impairment (OHI) and autism, which increased from approximately 303,000 to 1.15 million and 93,000 to nearly 980,000 students, respectively, across multiple decades (NCES, 2024). Prior research has documented similar administrative shifts in special education classification over time, especially as autism identification expanded (Shattuck, 2006).
Concurrently, schools have increasingly emphasized mental health screening, multi-tiered systems of support (MTSS)/positive behavior interventions and supports (PBIS) frameworks, school-based mental health services, and Section 504 accommodations rather than ED classification, with national estimates indicating that roughly one third of U.S. public schools now conduct some form of mental health screening (RAND Corporation, 2025; U.S. Department of Education, 2023). As a result, while ED counts remain low, evaluators increasingly encounter ED-presenting concerns—such as anxiety, depression, trauma exposure, school avoidance, and self-harm risk—whose supports are often delivered outside the ED eligibility label (CDC, 2023; Kids Mental Health Info, 2023; NCES, 2024).
At the same time, advances in assessment practices and increased awareness of student mental health needs have reshaped how eligibility teams conceptualize emotional and behavioral difficulties. Although the federal definition and eligibility criteria for ED under IDEA have remained largely unchanged, diagnostic practices have evolved toward greater emphasis on functional impairment, contextual influences, and multi-source data rather than isolated behavioral observations (NCES, 2024). Structured decision-making tools, such as the Emotional Disturbance Decision Tree (EDDT), were developed to improve the consistency, transparency, and defensibility of ED determinations by explicitly linking observed characteristics to IDEA criteria and educational impact.
In parallel, expanded access to school-based mental health services, tiered interventions, and early identification efforts have enabled many students to receive targeted supports without immediate ED classification (NCES, 2024). The COVID-19 pandemic further intensified emotional and behavioral challenges among students while simultaneously disrupting evaluation timelines and accelerating reliance on intervention-based supports rather than categorical identification (CDC, 2022).
Compounding these systemic shifts are enduring diagnostic and interpretive challenges embedded in the ED category itself. Federal criteria remain only loosely operationalized, with key terms such as “marked degree” and “long period” lacking precise definitions, resulting in substantial variability in interpretation across states and districts. The distinction between ED and social maladjustment (SM) remains particularly problematic, as SM is not clearly defined in federal regulations or the DSM-5 and overlaps behaviorally with ED (Sullivan & Sadeh, 2014).
Moreover, ED shares symptom profiles with numerous DSM-5 diagnoses—including anxiety disorders, depressive disorders, bipolar disorder, schizophrenia, attention deficit/hyperactivity disorder (ADHD), and conduct disorder— yet the presence of a DSM-5 diagnosis alone does not establish ED eligibility. These complexities are further shaped by stigma and family or district preferences, which may influence category selection in order to avoid labeling or to access preferred programming. Despite overall growth in special education services, the proportion of students identified under ED has declined steadily since the late 1990s and early 2000s, whereas autism and OHI have expanded markedly (Smartick, 2023). Collectively, these structural, diagnostic, and service delivery dynamics help explain the sustained contraction of ED identification within the IDEA framework.
As previously mentioned, the EDDT (Euler, 2024) is a standardized, norm-referenced assessment tool specifically designed to assist in the identification of students who may qualify for special education under the federal category of ED as defined by IDEA. The EDDT is unique in its direct alignment with IDEA criteria, offering three forms (Teacher, Parent, and Self-Report) to capture a comprehensive view of a student’s functioning across settings and informants.
The Teacher and Parent forms are appropriate for students ages 5–18 years, while the Self-Report Form is designed for students ages 9–18 years. The EDDT’s structure includes sections that address both inclusionary and exclusionary IDEA criteria, such as the presence of ED characteristics, exclusionary factors (e.g., intellectual, sensory, or health issues), severity, duration, educational impact, and the presence of conditions like ADHD, psychosis, and social maladjustment. The instrument is administered in print or digitally and scored digitally, ensuring accuracy and efficiency.
A key strength of the EDDT is its multi-rater approach, which systematically gathers data from teachers’, parents’, and the student’s perspectives. This approach recognizes that behavior and emotional functioning can vary significantly across environments and informants, and that discrepancies between raters are often clinically meaningful rather than problematic. Critically, the EDDT includes a Criteria Table (Figure 1) that maps each assessment section and scale directly onto the federal IDEA criteria for ED, facilitating clear, defensible eligibility determinations. For example, the Teacher Form includes sections that address the required duration (“over a long period of time”), marked degree of symptoms, and adverse educational impact, while all forms assess the core ED characteristics (e.g., relationship difficulties, inappropriate behaviors or feelings, pervasive mood/depression, and physical symptoms/fears). The Social Maladjustment (SM) cluster, present on all forms, helps differentiate ED from SM, as required by IDEA, while also allowing for the identification of comorbid presentations. By structuring its content to mirror IDEA’s legal requirements, the EDDT provides practitioners with a defensible, evidence-based framework for ED assessment and eligibility decisions.
Best practices for the assessment of ED emphasize a comprehensive, team-based, and culturally responsive approach. Effective ED assessment integrates multiple data sources such as reviewing records, conducting interviews, observing behavior across settings, and administering standardized tests to ensure findings are cross-validated and robust (Fisher et al., 2007).
Eligibility decisions should always be made by a multidisciplinary team, drawing on the collective expertise of educators, psychologists, and other relevant professionals, rather than relying on a single assessment or rater. It is essential to consider cultural and linguistic diversity throughout the process, ensuring that assessment tools and interpretations are appropriate and equitable for students from all backgrounds. Early identification and intervention are also critical, as timely screening and support can significantly improve long-term outcomes for students with ED (Lambert et al., 2024). These best practices are reflected in leading guidelines and are embedded in tools like the EDDT, which supports multi-informant assessment, structured alignment with IDEA criteria, and sensitivity to individual student context.
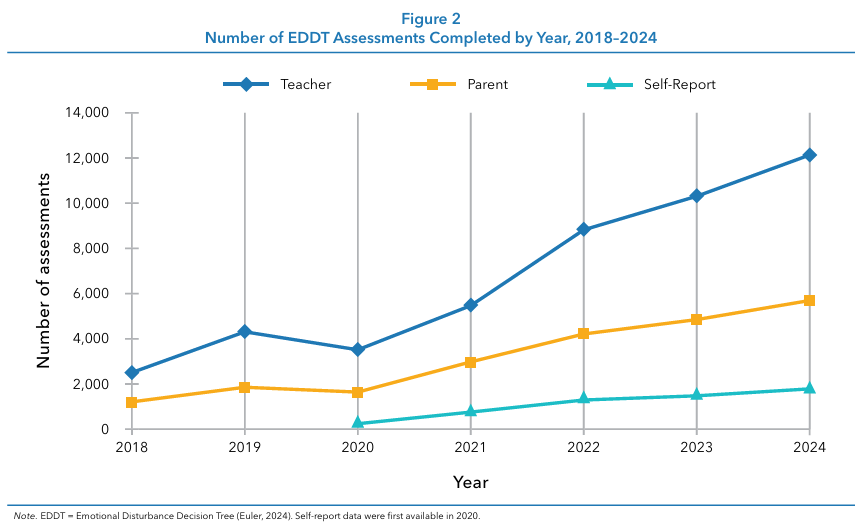
Analyses of EDDT data from 2018 to 2024 reveal consistent trends aligning with national findings. The dataset includes assessments for 47,101 children and adolescents rated by teachers, 22,631 rated by parents, and 5,909 students themselves, offering a robust sample for examining identification patterns and behavioral outcomes (see Figure 2).
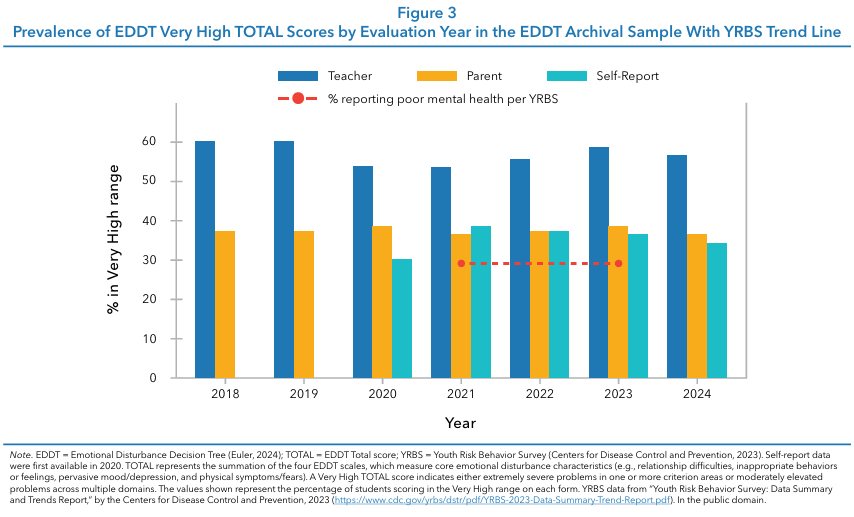
Although national data show that the prevalence of ED has declined (OSERS, 2024), indicators of youth emotional distress continue to rise (CDC, 2023). Archival EDDT data reflect this same divergence, demonstrating growth patterns consistent with national IDEA trends (see Figure 3). Figure 3 presents the percentage of children scoring in the Very High range on the EDDT TOTAL score from 2018 to 2024 across Teacher, Parent, and Self-Report forms, alongside national YRBS data on poor mental health.
Across all years, a substantial proportion of students exhibited severe emotional and behavioral concerns, with teacher ratings consistently highest (53%–60%), followed by parent (36%–38%) and self-report ratings (30%–38%) from 2020 onward. After a brief decline in 2020 associated with COVID-19 disruptions, both EDDT utilization and severity indicators increased sharply beginning in 2021. These trends closely parallel YRBS findings of persistently elevated youth distress (29% in both 2021 and 2023), reinforcing the conclusion that although ED identification has declined nationally, the clinical severity of emotional and behavioral needs among referred students remains high and stable, underscoring the importance of structured, evidence-based assessment practices.
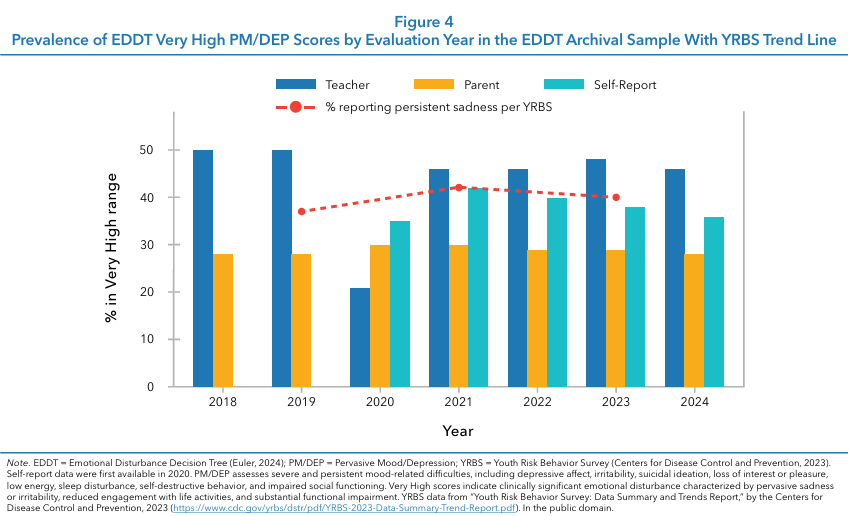
Parallel patterns emerged for mood and depressive symptomatology on the Pervasive Mood/Depression (PM/ DEP) scale (see Figure 4). A substantial proportion of students were classified in the Very High range on the PM/DP scale, with teacher ratings initially high in 2018–2019 (50%) before a sharp decline in 2020 (21%) coinciding with COVID-19 disruptions, followed by a sustained rebound from 2021 through 2024 (46%–48%). Parent ratings remained comparatively stable across years (28%–30%), while self-report ratings—available beginning in 2020—indicated consistently high levels of severe depressive symptomatology (35%–42%). Notably, the temporal pattern of EDDT PM/DEP severity closely paralleled national YRBS trends in persistent sadness, which remained elevated in 2019 (37%), 2021 (42%), and 2023 (40%), reinforcing the conclusion that clinically significant mood disturbance among referred students has remained both widespread and stable despite broader shifts in special education identification practices.
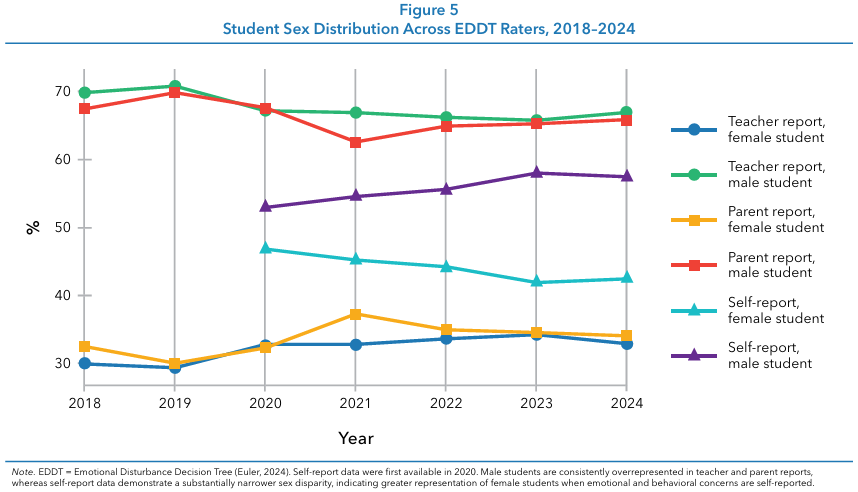
Males are disproportionately classified with ED, likely due to the prevalence of externalizing behaviors. Females may be underidentified due to the tendency to exhibit internalizing symptoms over time. The EDDT data support these national trends. Across the 2018–2024 period, clear and consistent differences in sex distribution emerged across EDDT informant sources (see Figure 5). Teacher reports exhibited the strongest male predominance, with males comprising approximately two thirds of evaluations each year (≈66%–71%) and females representing about one third. Parent reports showed a similar pattern, though slightly less pronounced, with males accounting for roughly 63%–70% of cases and a modest increase in female representation over time.
In contrast, SelfReport data (2020–2024) revealed a markedly more balanced distribution, with females composing 42%–47% of respondents and males 53%–58%. Collectively, these findings underscore the importance of multi-informant assessment and suggest that reliance on adult reports alone may contribute to the underidentification of emotional distress among female students.
Although national IDEA data demonstrate a steady decline in overall ED identification over the past decade, the racial distribution of students who continue to receive the ED label remains highly disproportionate, with Black or African American students being 2.28 times more likely to receive services for ED compared to peers from other racial and ethnic groups. Black/African American students (risk ratio = 1.8), American Indian/Alaska Native students (1.6), and students of two or more races (1.6) are substantially overrepresented among those identified with ED, while Asian (0.2) and Hispanic/Latino (0.7) students are markedly underrepresented. Unfortunately, data on race and ethnicity are not available for the EDDT.
However, when these findings are interpreted alongside the national ED trend data—showing that ED now composes only about 4.3%–4.4% of IDEA eligibility, the lowest share in decades—these findings indicate that ED identification is becoming both rarer and more inequitable (Office of Special Education Programs, 2022). In other words, as systems increasingly divert emotional and behavioral needs into alternative pathways (e.g., OHI, autism, MTSS, and Section 504), the ED label is being applied to a smaller but more demographically patterned group of students, intensifying the equity implications of ED eligibility decisions and underscoring the need for structured, bias-aware assessment practices.
This may reflect systemic biases, differences in behavior interpretation, and access to services. Socioeconomic status also plays a role, as students living in poverty are more likely to experience adverse childhood experiences and environmental risk factors, though schools are not required to report income levels in special education data.
Across the 7-year period examined, national IDEA data reveal a clear and sustained decline in ED identification that predates, spans, and extends beyond the COVID-19 pandemic, indicating a structural rather than cyclical trend (see Table 1). ED counts decreased steadily from 2016–2017 through 20182019, with ED’s share of the IDEA population dropping from approximately 5.0% to 4.6% prior to the pandemic. The most pronounced numerical decline occurred between 2019–2020 and 2020–2021, consistent with widespread evaluation slowdowns and eligibility deferrals during COVID-19.
Notably, ED identification has not rebounded in the post-pandemic period; both raw counts and proportional representation remain below pre-COVID levels, with ED now comprising roughly 4.3%–4.4% of students served under IDEA, the lowest share observed in decades. Taken together, this uninterrupted pattern across pre-COVID, COVID, and post-COVID years provides compelling evidence of a systemic shift away from ED identification, occurring despite well-documented increases in internalizing mental health concerns among youth.
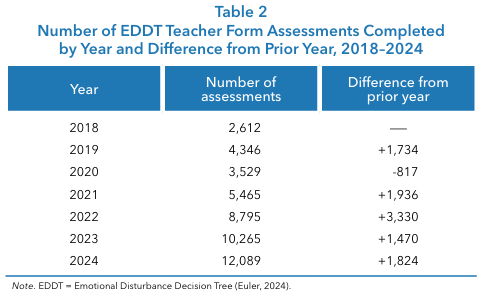
From 2018 to 2024, use of the EDDT increased dramatically, indicating rapid and sustained adoption by schools and practitioners (see Table 2). The number of completed EDDT assessments completed by teachers grew from 2,612 in 2018 to 12,089 in 2024, representing a more than fourfold increase over 6 years. Although usage declined in 2020, coinciding with the onset of the COVID-19 pandemic and widespread disruptions to evaluation services, this decrease was temporary. Beginning in 2021, EDDT utilization rebounded sharply, with particularly large year-to-year increases in 2021 and 2022, followed by continued strong growth in 2023 and 2024. Overall, the trend reflects accelerating reliance on structured ED assessment practices, with post-pandemic adoption exceeding pre-pandemic levels and continuing to rise steadily through 2024.
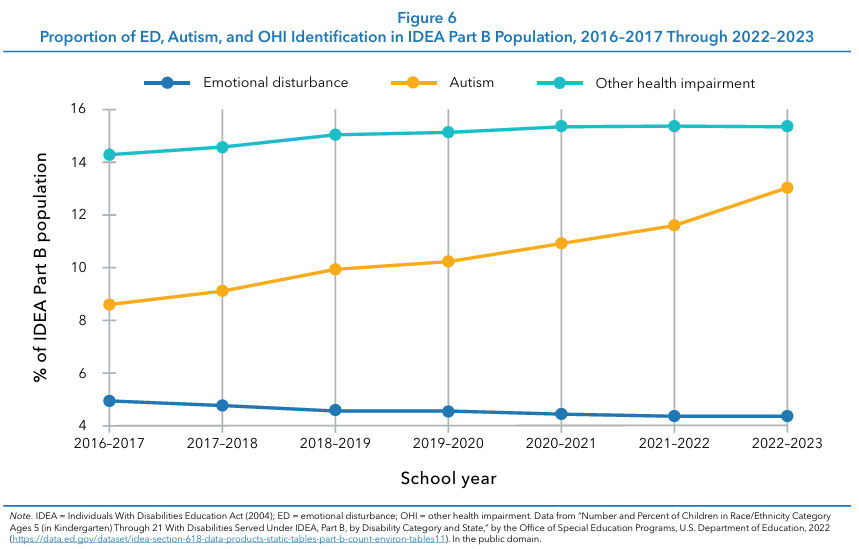
ED often co-occurs with other disabilities, such as ADHD and conduct disorder, and is impacted by trauma. Emotional dysregulation is a common thread, with genetic and environmental factors contributing to the overlap. Trauma, especially adverse childhood experiences, increases the risk for ED and related disorders. National data demonstrate that ED has declined steadily as a proportion of the IDEA population from 2016–2017 through 2022–2023, while autism and OHI have increased over the same period (see Figure 6). This shift is consistent with improvements in autism screening and early detection, as well as the relatively subjective and expansive eligibility criteria for OHI, which explicitly encompass ADHD and related conditions. As a result, students whose difficulties involve significant emotional, behavioral, and attentional regulation challenges are increasingly being classified under autism or OHI rather than ED.
This structural shift is mirrored in the EDDT archival data. Despite the decline in ED identification nationally, students referred for ED-related evaluation continue to present with high levels of clinically significant psychopathology across multiple domains. EDDT cluster analyses from 2018–2024 reveal persistent elevations in ADHD-related behaviors across teacher, parent, and self-report ratings, as well as sustained concerns associated with psychosis-related symptoms, particularly in teacher and self-report data. For the ADHD cluster, teacher ratings in the High Clinical range remained relatively stable over time (10%–14%), while parent ratings were consistently high (26%–29%), and self-report ratings—available beginning in 2020—showed substantial elevations (20%–25%), suggesting persistent attentional and regulatory difficulties reported across informants. The Psychosis cluster demonstrated a different pattern, with teacher ratings remaining elevated and stable (16%–21%), parent ratings consistently low (2%–3%), and self report ratings indicating moderate but meaningful levels of high clinical concern (6%–13%) across years.
The presence of these complex and enduring symptom profiles indicates that the underlying severity of student need has not diminished. Instead, the observed national decline in ED identification appears to reflect changing classification practices rather than improvements in student mental health. Together, these findings suggest that contemporary special education systems are redistributing emotional and behavioral needs across alternative eligibility categories, even as the clinical complexity of referred students remains consistently high.
ED affects academic performance, social relationships, and overall school functioning. Students with ED often struggle with impulsivity, poor self-monitoring, low self-esteem, and inadequate coping skills (Cullinan et al., 1992; Lambert et al., 2021).
Effective intervention strategies for students with ED require a proactive, collaborative, and evidence-based approach within educational settings. Early identification is crucial, utilizing screening tools and systematic teacher observations to recognize students at risk before challenges escalate. Schools should implement MTSS, beginning with universal, school-wide PBIS, and progressing to more targeted or individualized interventions as needed (Walker & Gresham, 2015; Young et al., 2019). Collaboration among teachers, school psychologists, counselors, and families is essential to ensure interventions are coordinated and responsive to each student’s unique needs. Evidence-based programs, such as cognitive-behavioral interventions, social skills training, and structured classroom management techniques, have demonstrated effectiveness in improving emotional regulation, social functioning, and academic engagement for students with ED (Jones et al., 2016).
By integrating these strategies within a supportive school climate, educators can better address the complex needs of students with ED and promote positive educational and life outcomes.
IDEA 2004 remains the guiding framework for ED eligibility, but clearer guidelines and definitions are needed to address diagnostic challenges and ensure equitable support. Recommendations for policy improvements in the identification and support of students with ED should focus on increasing clarity, equity, and access within the special education system.
First, policymakers should work to clarify and operationalize key IDEA criteria, such as “marked degree,” “long period,” and exclusionary factors, to ensure more objective, consistent, and defensible eligibility determinations across states and districts. Ambiguity in these definitions has historically contributed to inconsistent practices and potential inequities.
Second, targeted policies are needed to address disproportionality in ED identification and placement, particularly for students from racially, ethnically, and socioeconomically marginalized backgrounds. This includes implementing bias-reduction training, monitoring data for disparities, and ensuring culturally responsive assessment practices.
Finally, increasing access to mental health services within schools is essential; this can be achieved by expanding funding for school-based mental health professionals, integrating community partnerships, and supporting comprehensive, multi-tiered systems of care. Together, these policy improvements can promote fairer, more effective, and more inclusive support for students with ED.
Future research and emerging trends in the field of ED are increasingly focused on understanding the complex intersections between ED and related conditions such as ADHD, conduct disorder, and trauma, recognizing that many students present with overlapping symptoms and needs. Longitudinal studies are needed to track changes in the prevalence, identification, and outcomes of ED over time, providing insights into the effectiveness of interventions and policy shifts.
There is also a growing emphasis on the development and validation of innovative assessment tools that can facilitate earlier and more accurate identification of ED, particularly those that account for comorbidities and diverse student populations. Additionally, the integration of technology holds promise for enhancing both assessment and support, making services more accessible and responsive. These research directions will help make more nuanced, equitable, and effective approaches to supporting students with ED in the years ahead.
Diagnosing and supporting students with ED remains a complex and evolving challenge. Although the federal definition of ED has remained largely unchanged for decades, contemporary research on child mental health, trauma, and equity underscores the need for more precise, consistent, and developmentally responsive assessment practices. National data continue to show that ED represents a small and declining share of IDEA eligibility, while significant disparities persist, including pronounced sex differences and disproportionate identification of Black or African American students.
Within this context, the EDDT offers a practical, evidence-based framework for improving the quality and equity of ED eligibility decisions. Its structured, multi-informant approach supports transparent alignment with federal criteria while centering functional impairment and educational impact. Moving forward, policy and practice should emphasize clearer eligibility guidance, integration with modern school mental health frameworks, and systematic reduction of reliance on subjective or discipline-driven decision-making. As student mental health needs continue to grow in complexity, tools such as the EDDT provide schools with a defensible pathway toward compliance, consistency, and improved outcomes for students with significant emotional and behavioral challenges.
Annual Disability Statistics Compendium. (2024). Education: Students served under IDEA, Part B. https://www.researchondisability.org
Centers for Disease Control and Prevention. (2022). Data and statistics on children’s mental health. https://www.cdc.gov/children-mental -health/data-research/
Centers for Disease Control and Prevention. (2023). Youth Risk Behavior Survey: Data summary and trends report. https://www.cdc.gov/yrbs /dstr/pdf/YRBS-2023-Data-Summary-Trend-Report.pdf
Clarizio, H. F. (1992). Social maladjustment and emotional disturbance: Problems and positions: II. Psychology in the Schools, 29(4), 331–341. https://psycnet.apa.org/doi/10.1002/1520-6807(199210) 29:4%3C331::AID-PITS2310290406%3E3.0.CO;2-4
Costenbader, V., & Buntaine, R. (1999). Diagnostic discrimination between social maladjustment and emotional disturbance: An empirical study. Journal of Emotional and Behavioral Disorders, 7(1), 2–10. https://doi.org/10.1177%2F106342669900700101
Cullinan, D., Epstein, M. H., & Sabornie, E. J. (1992). Selected characteristics of a national sample of seriously emotionally disturbed adolescents. Behavioral Disorders, 17(4), 273–280. https://doi.org/10.1177/019874299201700401
Euler, B. (2024). Emotional Disturbance Decision Tree (EDDT): Professional manual. PAR.
Fisher, E. S., Doyon, K. E., Saldana, E., & Allen, M. R. (2007). Comprehensive assessment of emotional disturbance: A cross validation approach. The California School Psychologist, 12, 47–58. https://psycnet.apa.org/doi/10.1007/BF03340931
Individuals With Disabilities Education Act, 34 C.F.R. § 300.8(c)(4) (2004). https://sites.ed.gov/idea/regs/b/a/300.8/c/4
Jones, V., Greenwood, A., & Dunn, C. (2016). Effective supports for students with emotional and behavioral disorders: A continuum of services. Pearson.
Kids Mental Health Info. (2023). Facts and figures: Data on students served under IDEA. https://kidsmentalhealthinfo.com
Lambert, M. C., Katsiyannis, A., Epstein, M. H., Cullinan, D., & Sointu, E. (2021). Profiles of emotional disturbance across the five characteristics of the federal definition. Behavioral Disorders, 47(4), 223–235. https://doi.org/10.1177/01987429211033567 (Original work published 2022)
Lambert, M. C., Katsiyannis, A., Maag, J. W., Mason, W. A., & Epstein, M. H. (2024). Long-term trends in socially maladjusted behavior of students with and without emotional and behavioral disorders: A 22-year repeated cross-sectional study. Behavioral Disorders, 50(2), 63–75. https://doi.org/10.1177/01987429241269464
National Center for Education Statistics. (2024). Digest of education statistics (Table 204.30). U.S. Department of Education. https://nces.ed.gov
Office of Special Education and Rehabilitative Services (OSERS). (2024). 45th annual report to Congress on the implementation of the Individuals with Disabilities Education Act. U.S. Department of Education. https://www.govinfo.gov/content/pkg/CMR-ED1-0018 7514/pdf/CMR-ED1-00187514.pdf
RAND Corporation. (2025). School-based mental health screening and services in U.S. public schools. https://www.rand.org
Shattuck, P. T. (2006). The contribution of diagnostic substitution to the growing administrative prevalence of autism in U.S. special education. Pediatrics, 117(4), 1028–1037. https://doi.org/10.1542 /peds.2005-1516
Smartick. (2023). The number of students in special education in the U.S. https://www.smartick.com
Sullivan, A. L., & Sadeh, S. S. (2014). Differentiating social maladjustment from emotional disturbance: An analysis of case law. School Psychology Review, 43(4), 450–471. https://doi.org/10.1080/0279 6015.2014.12087415
U.S. Department of Education. (2023). Supporting child and student mental health. https://www.ed.gov
Office of Special Education Programs. (2022). Number and percent of children in race/ethnicity category ages 5 (in kindergarten) through 21 with disabilities served under IDEA, Part B, by disability category and state. [Data file]. U.S. Department of Education. https://data.ed .gov/dataset/idea-section-618-data-products-static-tables-part-b -count-environ-tables11
Walker, H. M., & Gresham, F. M. (2015). Handbook of evidence-based practices for emotional and behavioral disorders: Applications in schools. Guilford Press.
Young, N. D., Fain, A., & Citro, T. A. (2019). Creating compassionate classrooms: Understanding the continuum of disabilities and effective educational interventions. Vernon Press.